Location:Home >> Detail
J Psychiatry Brain Sci. 2016; 1(5): 1; https://doi.org/10.20900/jpbs.20160019
 ,
Jinwen Wei1,
Shuang Liu1,
Jiayuan Meng1,
Xingwei An1,
Hongzhi Qi1,2,
Feng He1,
Xuemin Wang1,
Mattew Scott3,
Dong Ming1,2,
Mengting Liu3 *
,
Jinwen Wei1,
Shuang Liu1,
Jiayuan Meng1,
Xingwei An1,
Hongzhi Qi1,2,
Feng He1,
Xuemin Wang1,
Mattew Scott3,
Dong Ming1,2,
Mengting Liu3 *
1 School of Precision Instrument and Optoelectronics Engineering, Tianjin University, Tianjin 300072, China
2 Tianjin Key Laboratory of Biomedical Detection Technology and Instrumentation, Tianjin 300072, China
3 Department of Psychological and Brain Sciences, University of Delaware, Newark, DE, USA, 19716
*Corresponding Author:
Peng Zhou. School of Precision Instrument and Optoelectronics Engineering, Tianjin University, Tianjin 300072, China. Tianjin Key Laboratory of Biomedical Detection Technology and Instrumentation, Tianjin 300072, China. 92 Weijin Rd, Nankai Qu, Tianjin Shi, China, 300072. Tel: +86-22-27409957.
Mengting Liu. Department of Psychological and Brain Sciences, University of Delaware 135 McKinly Lab, Newark, DE, USA, 19716. Tel: +1-225-304-1636.
Background: Emotion recognition is among the hot topics in the field of psychology and engineering. As a type of emotion, tension plays an important role in daily life. As such, tension intensity recognition (TIR) is of greatly value.
Method: This study employed selected clips of a horror movie to elicit tension of different intensity levels, during which four types of bio-signals were collected from 4 participants. These signals included electroencephalogram (EEG), electrocardiogram (ECG), respiration (RSP) and electrodermal activity (EDA) signals. After that, a support vector machine (SVM) based classification was performed to differentiate fear tension levels, employing features extracted from multi-physiological signals.
Results: EEG analysis showed that the power spectrum of EEG signals present monotonic changes with the increase of intensity at specific brain regions. The recognition accuracy using features from multiple physiology signals reached 83.33%.
Conclusion: To our knowledge, this is among the first studies to evaluate emotion intensity levels using multiple electro-physiological signals. Our study demonstrated the feasibility and effectiveness of using these physiological features for the assessment of tension levels, providing further insights in the field of quantitative emotion studies.
Emotion is a psycho-physiological process triggered by the conscious and/or unconscious perception of an object and is often associated with mood, temperament, personality disposition and motivation [1]. Recognizing emotional feedback is important for intelligent human-computer interaction [2]. Individuals usually express various emotions that are important in human-computer interactions. Many fields in real life could leverage the advanced of computational emotion recognize, including health care [3], games, and e-learning [4]. For example, if the emotion recognition is well-employed, services in the fields of medical care and driving could be more customer-friendly for aged people [3] and car drivers [5], respectively. However, current researches for emotions recognition are mainly focused on the detection of different emotion categories rather than intensity.
Tension of different intensity levels could play pivotal roles in conducting daily cognitive tasks. While moderate tension may contribute to task completion, over-relaxation or excessive tension can exert negative influence on one’s performance. Therefore, identifying an effective method for tension intensity recognition (TIR) can carry substantial significance. For an instance, it is necessary that an astronaut is trained to control their feelings and tension. Overwhelming tension could led to failed performance with serious consequences.
Although traditional methods, as such facial expressions, have been widely used to recognize emotion intensity levels, multi-physiological signals have begun to receive attention. This is due to the fact that these signals are more objective [6]. These signals including electroencephalogram (EEG), electrocardiogram (ECG), respiration (RSP) and electrodermal activity (EDA). In this study, we utilized a SVM scheme to recognize various intensities of tension elicited by using a film clips, with features extracted from electro-physiological signals including EEG, ECG, RSP and EDA. To our knowledge, this is the first study employing features of multi-physiological signals for TIR.
Four healthy participants (22-24 years of age; all males) were enrolled in this study. They were all undergraduates from Tianjin University. All participants reported normal capability in both vision and hearing. No participant had a history of severe medical or psychological treatment, nor with history of psychological or neurological disorders. This study was approved by the Ethics Committee of Tianjin University.
2.2 Experiment designOne type of emotion that can typically accompany tension is fear. Therefore, it has been decided to use horror films to elicit tension. After being screened by a committee group of emotion specialists, the film named Vacancy was chosen. Vacancy tells a story in which a couple encounters a psycho killers in their travels. To fill the requirement of avoiding bloody scenes while eliciting tension of different intensity levels, several clips of 24 minutes in total were carefully selected. Both specialists’ observation and participants’ feedback proved that the selected clips of horror movie reached the pre-set goal to elicit tension of different degrees.
2.3 Tension intensity scalingA Differential Emotions Scale (DES) was employed to assess discrete emotional dimensions [8]. The DES is one of the most widely used self-report scales of discrete emotional feelings [9]. To assess emotional categories objectively, in this study, we implemented a modified version of the DES that takes consideration of the following factors: fear, joy, tension, disgust, surprise, sadness, and anger. After watching the movie clips, the participants were asked to pinpoint the two most feeling-terrible clips.
After that, participants were required to provide a quantitative measure for the tension intensity exerted by the movie clips, with the instructions provided as follows. One means tension of low level intensity; two means medium; three means high tension level. The movie clips were separated into 6 time periods in advance to facilitate the tension evaluation by the participants. Each period lasted 3 to 4 minutes.
2.4 Data acquisitionThe EEG signals were acquired using a NeuroScan NuAmps 40-channel amplifier. The electrodes were placed on the scalp according to the extension of the international 10-20 electrode positioning system [7] as shown in Figure 1. EEG and other three types of signals (ECG, EDA, and RSP) were acquired simultaneously, with the later three by using Biopac MP150 system. The sampling rates were all set at 1000 Hz.
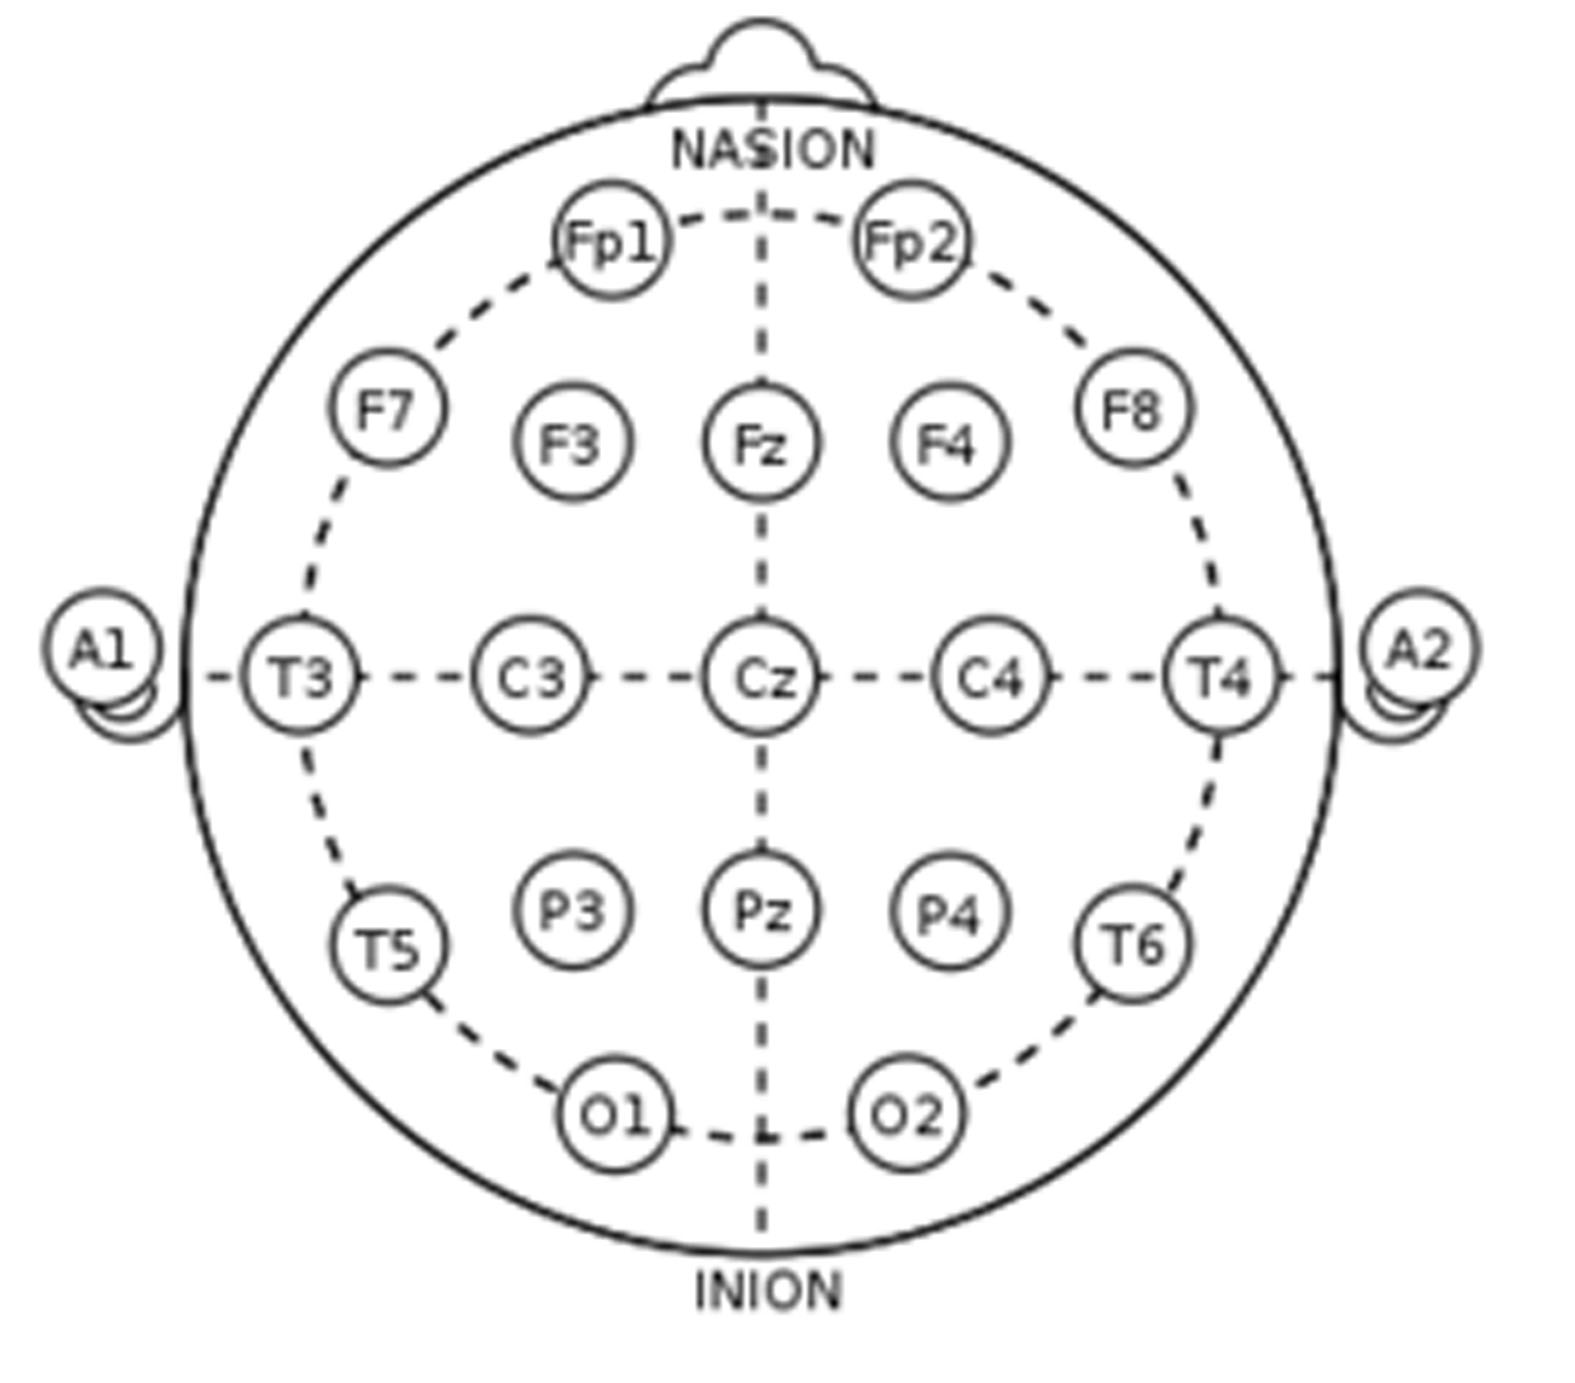 Figure 1 The international 10-20 electrode positioning system
EEG signals were acquired right after the emotion-introducing movie clips were prepared. The temperature and humidity of the lab were well-controlled during the whole experiment. The participants were instructed to make sure that they understand the detailed experimental procedures. Then, multi-physiological signals were acquired from each participant with electrodes attached on the head, fingers, and legs. When the participant was ready, lights was dimmed and the movie clips were presented on a big screen. After the movie show, participants was asked to finish the emotion tension scaling according to the design.
According to the self-reported scale that participants had filled out, three segments which included all intensity levels of tension were extracted. Each segment lasted approximately four minutes. To note, EOG signals were removed from EEG signal employing an independent component analysis (ICA) approach. In addition, all signals were down-sampled from 1000Hz to 500Hz to reduce the computational complexity of downstream processing, which still satisfies precision requirements.
2.6 Feature extraction and analysisA total of 199 features were extracted and used to differentiate intensities of tension, with180 features from EEG signals, and rest were from the other three types of electro-physiological signals (ECG, EDA, and RSP). The power spectral densities (PSDs) of different frequency bands were obtained by using Welch’s algorithm. The average spectral power from six frequency bins were picked out as features, including delta (1-4Hz), theta(4-8Hz), alpha(8-13 Hz), beta (13-30 Hz), gamma1 (30-36 Hz) and gamma2 (36-44 Hz) bands. A total of 180 (6 bands x 30 channels) EEG features were obtained from each participant.
In biomedical engineering, HRV is one of the most frequently used parameters for ECG analysis. To obtain HRVs from the continuous ECG signals, the wavelet transform was utilized to detect each QRS complex and determine the RR intervals (all intervals between adjacent R waves). Every data interception lasted only four minutes, during which seven time domain statistical features were calculated. These features included mean value, standard deviation of all NN intervals (SDNN), number of pairs of successive NN intervals differing by more than 50 ms (NN50), proportion of NN50 to the total number of NN intervals, standard deviation of the first difference of the HRV, mean square of the successive R-R intervals (RMSSD) and the number of R waves in one sample.
The RSP signals were collected by using a Hall Effect sensor attached around the chest. Accounting for variations in the initial tightness of the sensor’s placement, the signals were normalized by subtracting off the overall mean of the data. Then, the mean and variance of this normalized signal were calculated in time domain. The PSDs obtained by Welch's algorithm were also calculated, including frequency bands of 0~0.1Hz, 0.1~0.2Hz, 0.2~0.3Hz and 0.3~0.4Hz.
Six time domain statistical features were calculated for EDA signals, including mean value, standard deviation, first order difference, average value of first order difference absolute value, second order difference and average value of second order difference absolute value.
This study rigorously analyzed EEG features by using the topographic map of PSDs. First, for each sample and each tension intensity, the PSDs of all locations and frequency bands were calculated. Then the calculated PSDs were normalized and presented with the topographic map, which presents the quantitative and locational distribution of the EEG signals of different frequency bands.
2.7 Pattern classificationSVM is one of the most popular supervised learning algorithms for solving classification problems. The method has been widely used in the field of emotion recognition [10]. A 10-fold cross-validation was applied to the data for each participant, with the purpose to increase the reliability of the recognition results. Classified of tension intensities were performed based on different feature vectors: 1) only EEG features; 2) other physiological features (non-EEG features); 3) features from all 4 types of signals. Figure 2 presents the workflow of this study.
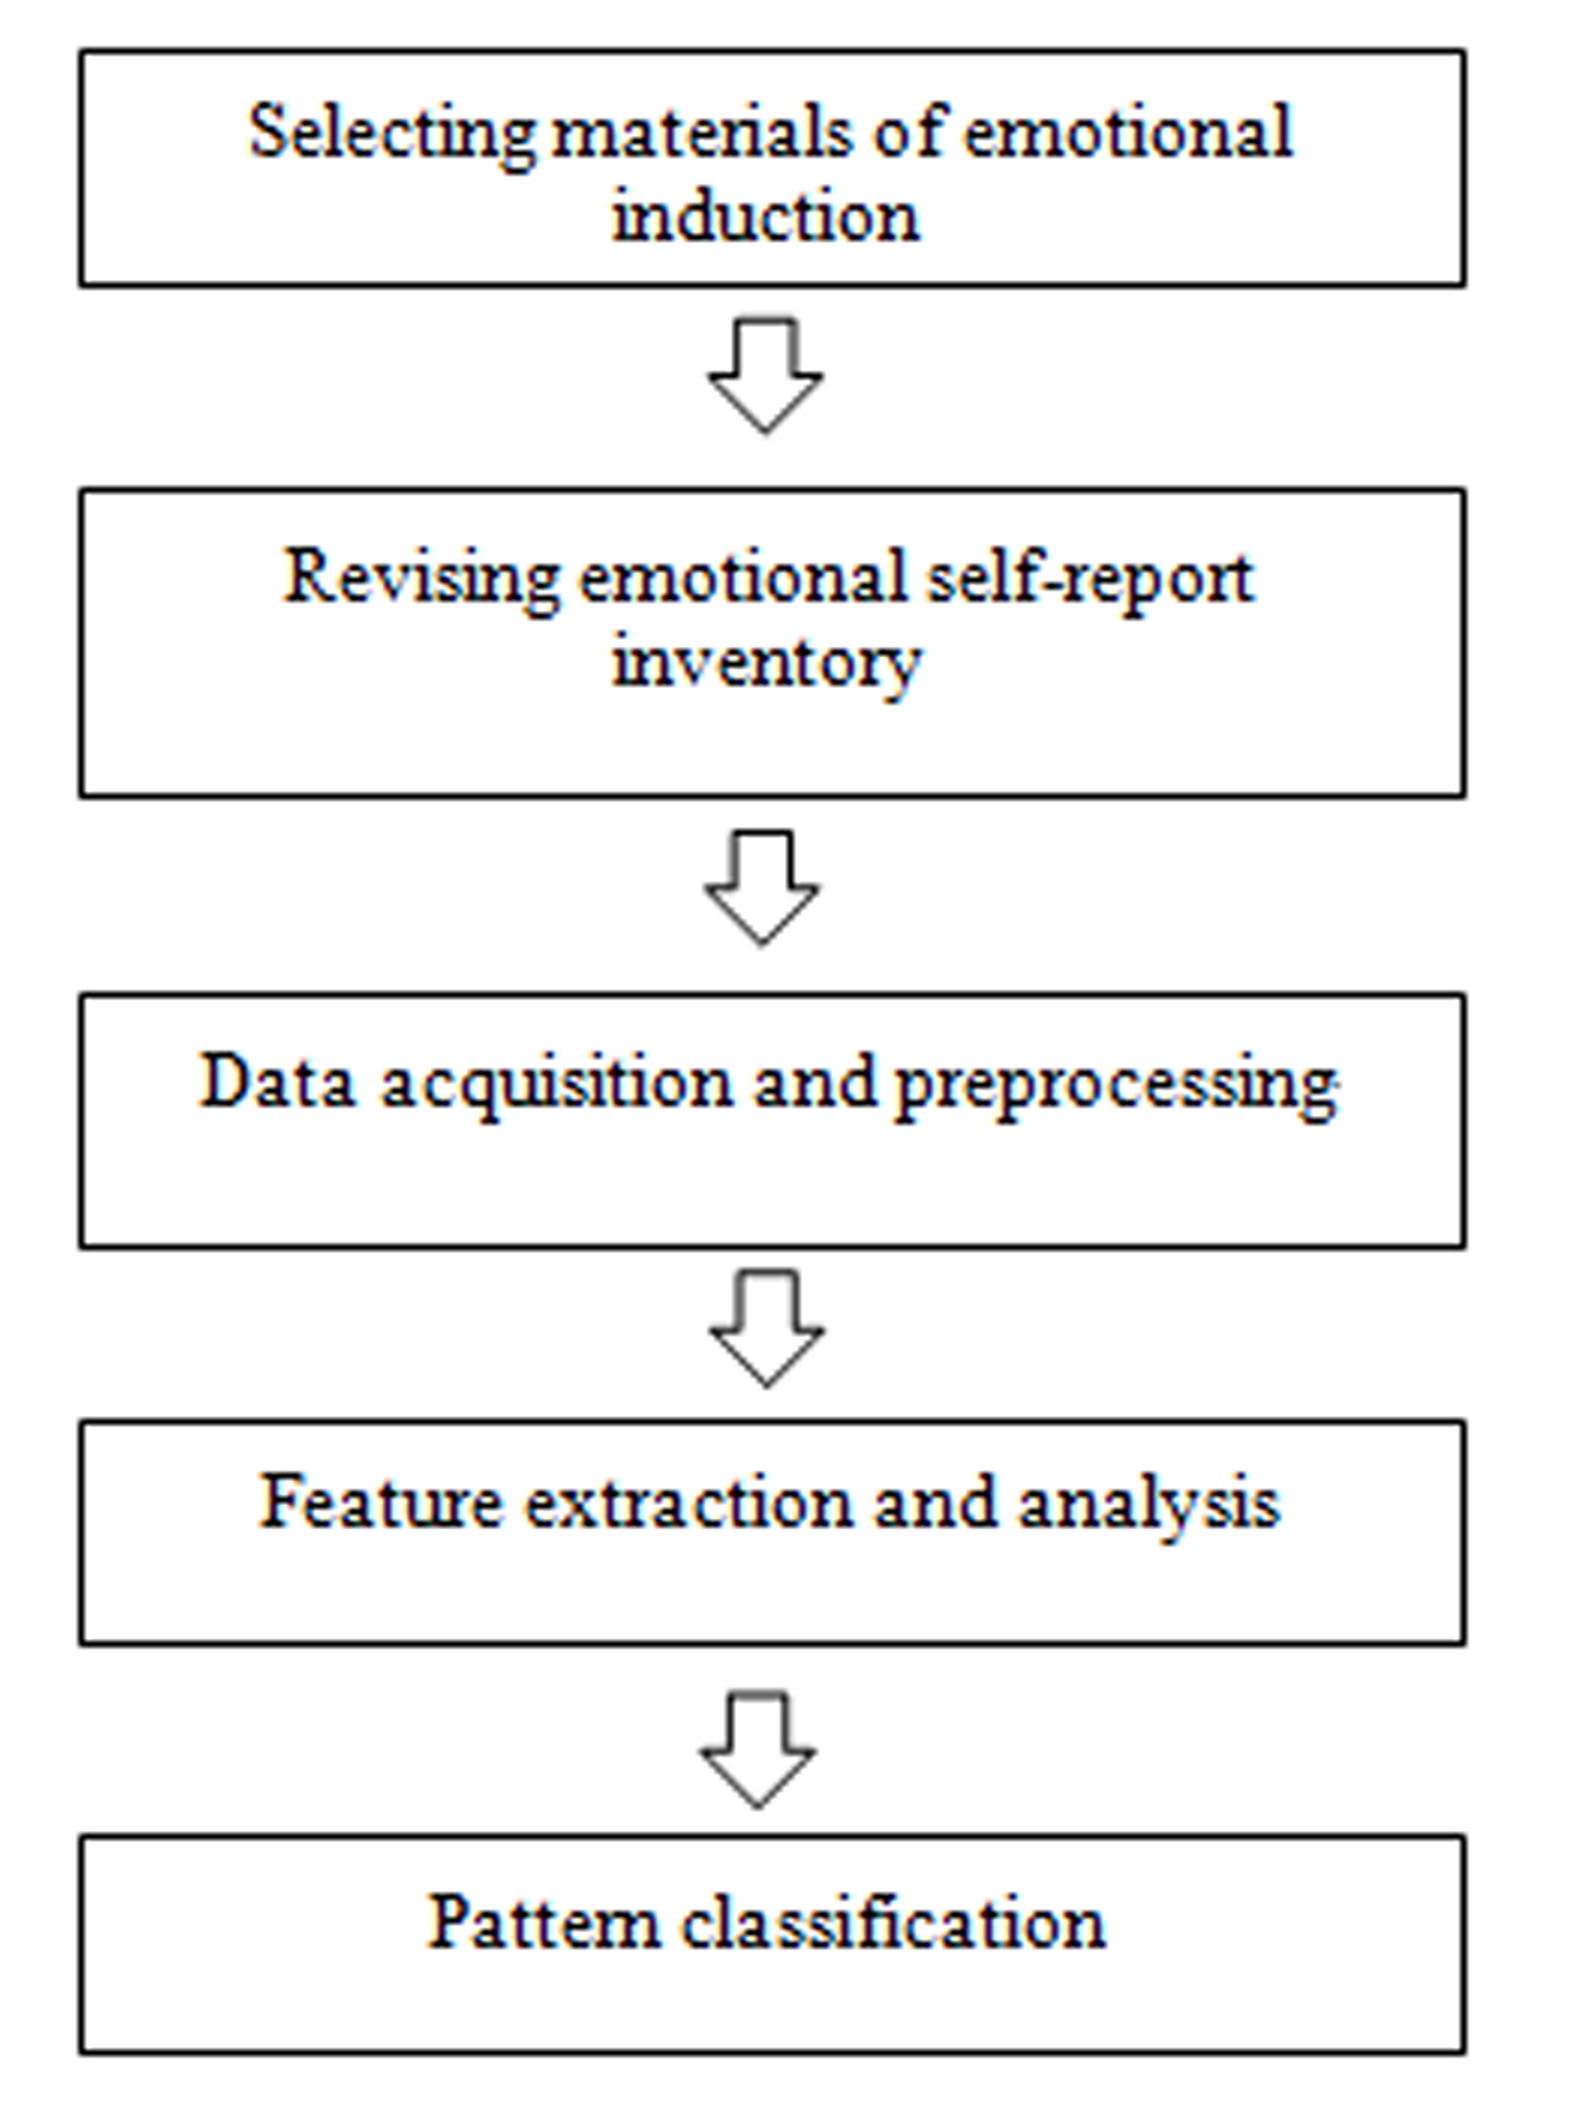 Figure 2 Overall procedures of this study
Previous studies demonstrate that the EEG signal power of certain frequencies are closely related to emotions [11, 12]. In this study, 180 features were extracted from EEG, while other 9 features were from other three types of physiological signals.
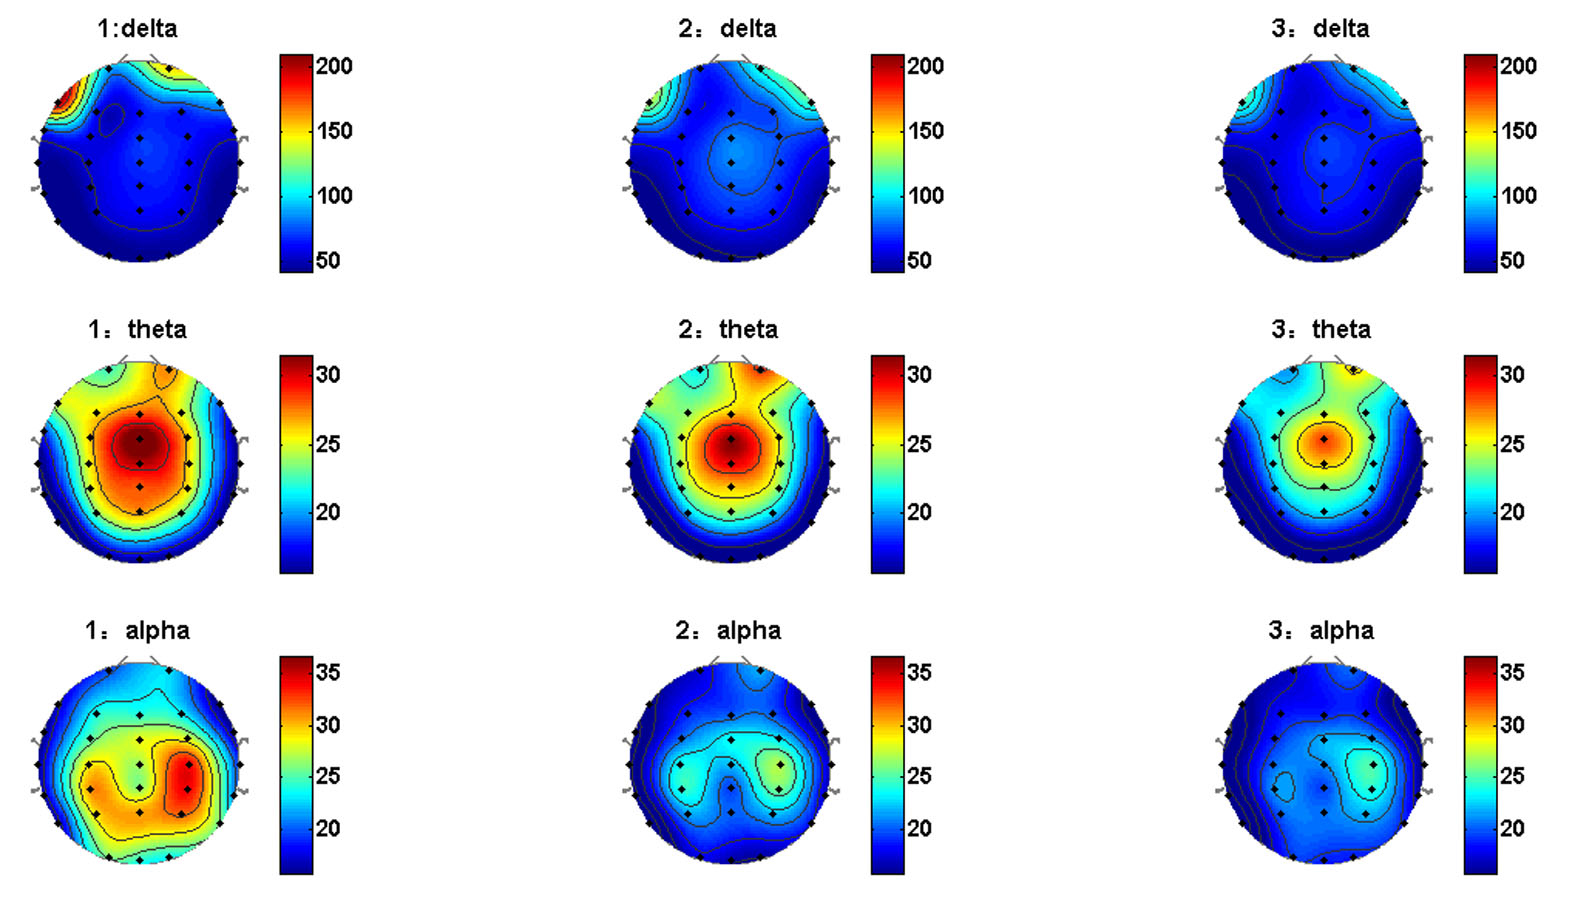
Figure 3 Topographic distribution of delta, theta and alpha bands averaged across four subjects. The intensity levels were added at the top of each figure. 1 represents low level of tension intensity (Fist column); 2 means medium (Send column; and 3 means high (Third column).
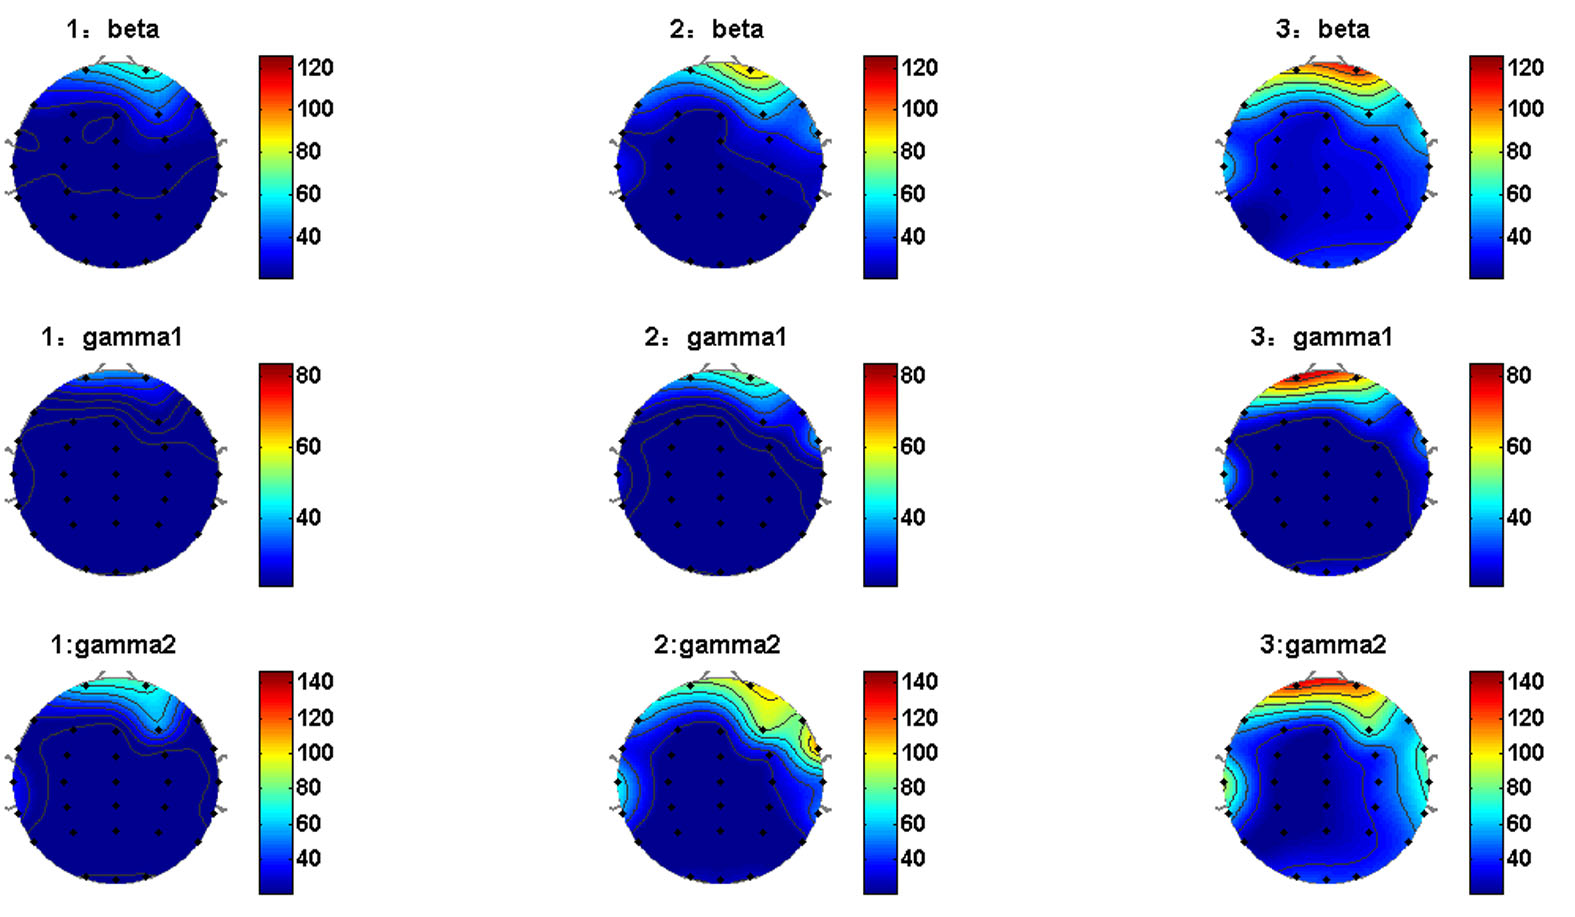
Figure 4 Topographic distribution of beta, gamma1 and gamma2 bands averaged across four subjects.The intensity levels were added at the top of each figure. 1 represents low level of tension intensity (Fist column); 2 means medium (Send column; and 3 means high (Third column)
Figure 3 and Figure 4 exhibit the topographic distributions of six frequency bands averaged across 4 subjects. From the two figures it can be seen that, the delta power mainly concentrates in the right prefrontal lobe and the inferior frontal lobe, theta power in the central lobe, alpha power mostly in the parietal lobe, and beta and gamma power (gamma1 and gamma2) in the prefrontal lobe. The concentrated power distribution indicated that movie-induced tension were mainly focused on specific brain regions. Moreover, the power of delta, theta, and alpha bands decrease monotonically with the increase of intensity. In contrast, the power of beta, gamma1 and gamma2 bands demonstrated increased pattern towards lower tension intensity. These results suggest that different tension intensity could lead to changes of different EEG power bands, which can be in dissimilar alteration patterns. Moreover, these EEG variations tend to appear at different brain regions.
3.2 Classification using SVMThis study utilized the libsvm toolkit, a MATLAB software package developed by Professor Lin Zhiren, who is with Taiwan University. The kernel functions used the Radius Basis Function (RBF) [13].
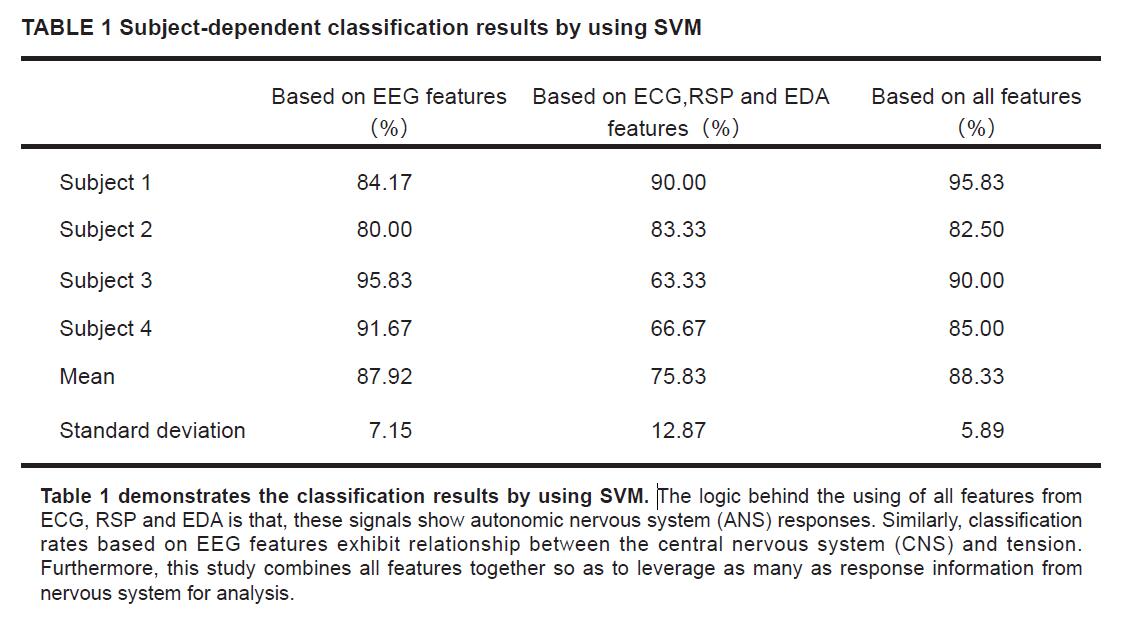 TABLE 1 SUBJECT-DEPENDENT CLASSIFICATION RESULTS BY USING SVM
All classification rate based EEG features were above 80%, with the mean accuracy reached 87.92%. This indicates that EEG features present strong separability for various intensities of tension. However, there are differences between individuals, which may reflect the physiological uniqueness of each subject.
The classification rates based on ECG, RSP and EDA features were all above 60 percent. The mean accuracy reached 75.83%, which indicates that autonomic nervous system features posse high potential to differentiate tension intensity levels. However, the standard deviation of accuracy is much higher than that of accuracy based on EEG features. This may be due to the fact that individuals present stronger variation in the automatic nervous system. Furthermore, it also should be noted that the number of features extracted from ANS is far less than that from CNS.
The classification accuracy based on all features varied from 82.50% to 95.83%. The mean value of accuracy reached 88.33 percent. However, the standard deviation is the least among three classification results. Indicating that integrating signals from both ANS and CNS could lead to better identification of tension intensity levels.
In this study, EEG, ECG, RSP and EDA signals were employed to classify tension intensity levels. The tension were elicited from 4 healthy participants by using selected horror film clips, and were scaled into three levels. The power of delta, theta and alpha bands decreased monotonically with the increase of intensity. The power of beta, gamma1 and gamma2 bands, however, increased monotonically with the increase of tension intensity. To our knowledge, this is the first study to identify these findings. These variation trends imply that different intensities of tension have a close relationship with EEG signal changes of certain spectrum bands.
The variation of the classification accuracies of different individuals reflect that each individual may present unique biological characteristics in terms of EEG and other physiological signals. This should be an important factor when one considers applying methods from this study afterwards. Meanwhile, the classification accuracy based on all multi-physiological signal features, which represents information from both ANS and CNS nervous system, reached over 80 % with lowest standard deviation. This suggests that using multi-physiological signals could lead to improved performance in the recognition of tension intensity.
Although we only tested the classification of fear emotion intensity, results from our study guarantee the feasibility of further research using more physiological features in tension intensity evaluation of other types. Moreover, this study is among the few studies that focus on intensity assessment of emotion, which is different from most of other research that emphasize the classification of emotion categories.
Our results indicated that the power spectrum of EEG signals demonstrate monotonic changes with the increase of intensity, which is a novel finding in the quantitative measure of emotions. Moreover, employing multiple physiological signals could lead to better emotion intensity level identification. Our results suggest the feasibility of using electrophysiological features for the assessment of emotion intensities, providing further insights in the field of emotion studies.
This study is partially supported by National Natural Science Foundation of China (No.51377120, 51007063, 31271062, 81222021, 61172008, 81171423), Natural Science Foundation of Tianjin (No.13JCQNJC13900), National Key Technology R & D Program of the Ministry of Science and Technology of China (No. 2012BAI34B02) and Program for New Century Excellent Talents in University of the Ministry of Education of China (No.NCET-10-0618).
The authors claim not conflict of interest.
1.
2.
3.
4.
5.
6.
7.
8.
9.
10.
11.
12.
13.
Zhou P, Wei J, Liu S, Meng J, An X, Qi H, He F, Wang X, Scott M, Ming D, Liu M. The Intensity Recognition of Tension Emotion Based on Multi-physiological Signals. J Psychiatry Brain Sci. 2016; 1(5): 1; https://doi.org/10.20900/jpbs.20160019

Copyright © 2020 Hapres Co., Ltd. Privacy Policy | Terms and Conditions


